KEY FIGURES
(€ MILLIONS, UNLESS STATED OTHERWISE) | ||
2019 | 2018 | |
Net turnover | 649.7 | 598.5 |
Operating income | 637.2 | 614.8 |
Added value | 502.7 | 477.7 |
Results | ||
EBITA recurring | 26.9 | 25.9 |
EBITA | 24.6 | 22.6 |
Net result | 9.2 | 12.7 |
Return on average shareholders' equity (%) | 6.0 | 8.9 |
EBITA margin, recurring (%) | 4.2 | 4.2 |
Earnings per share (€) | 1.80 | 2.51 |
Balance Sheet | ||
Total assets | 327.7 | 312.9 |
Shareholders' equity | 158.1 | 149.6 |
Group equity | 157.9 | 149.7 |
Group equity as percentage of total assets (%) | 48.2 | 47.8 |
Financial Position | ||
Net working capital | 17.4 | 14.0 |
Free cash flow | 2.0 | 17.4 |
Net turnover | Amounts invoiced to clients (excluding VAT), excluding invoiced in advance |
Operating income | Net turnover adjusted for change in work in progress, including other operating income, excluding non-operational items |
Added value | Operating income less cost of work subcontracted and other external charges |
EBITA recurring | EBITA excluding non-operational items |
Non-operational items | Restructuring costs and other one-off items |
EBITA margin | EBITA recurring / Operating income |
Return on average shareholders' equity | Net result / Average shareholders' equity |
Earnings per share | Net result / Number of ordinary shares issued |
Net working capital | Current assets less current liabilities (excluding cash and cash equivalents less amounts owed to credit institutions) |
Free cash flow | Cash flow from operating and investing activities |

ACCIDENTS & INCIDENTS
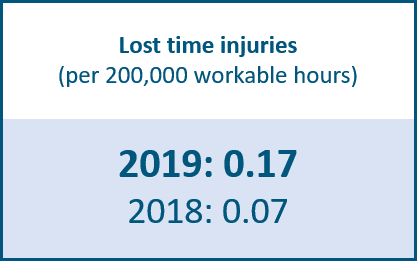
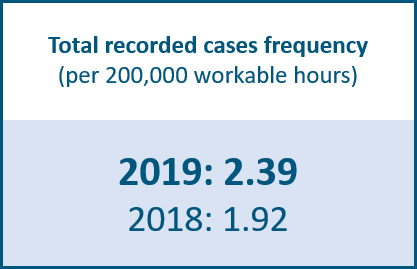
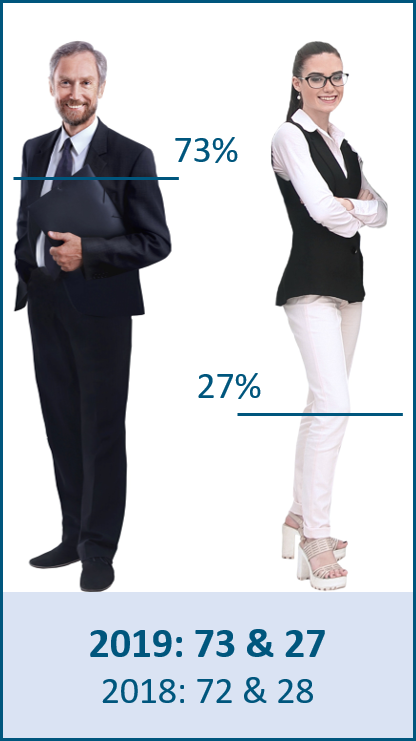
STAFF GENDER PERCENTAGE
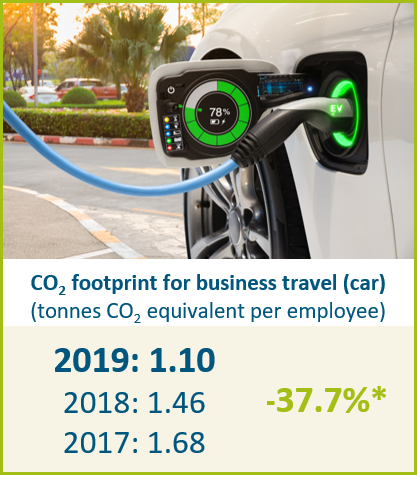
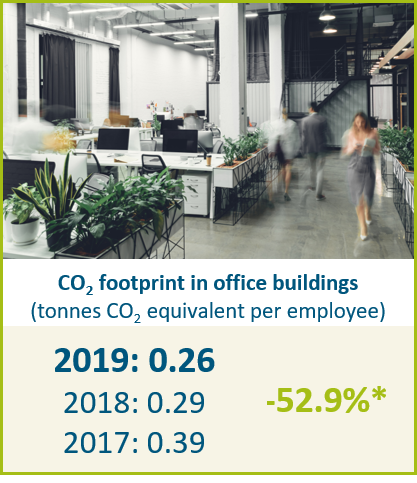
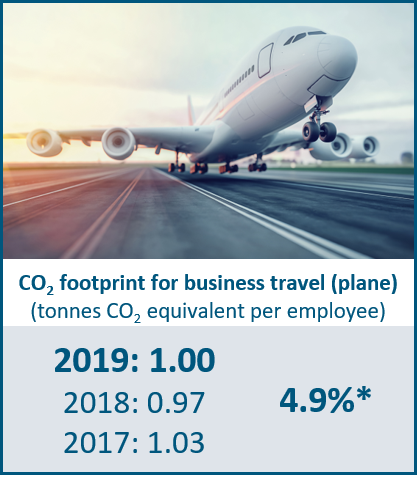
CARBON FOOTPRINT PER EMPLOYEE
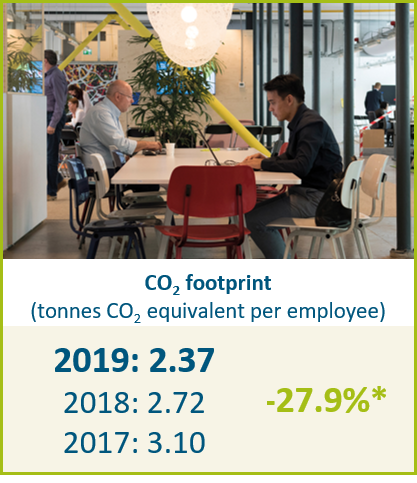
* Trend (to 2016)