Key Figures
Header image: In 2021 digital consultancy Novius, who joined our company the year before, developed the integral systems architecture for Schiphol's new terminal and pier. The architecture comprises 50 types of operational systems like security lanes, cameras, sensors, access gates and baggage systems – everything the airport needs to move passengers and luggage comfortably and safely. Read more about this project on our website
(€ millions, unless stated otherwise) | |||||
2021 | 2020 | ||||
Net turnover | 623.7 | 593.9 | Net turnover | Amounts invoiced to clients (excluding VAT), excluding invoiced in advance | |
Operating income | 619.3 | 590.9 | Operating income | Net turnover adjusted for change in work in progress, including other operating income, excluding non-operational items | |
Added value | 501.2 | 478.4 | Added value | Operating income less cost of work subcontracted and other external expenses | |
Results | |||||
EBITA recurring | 30.9 | 28.3 | EBITA recurring | EBITA excluding non-operational items (restructuring costs and other one-off items) | |
EBITA | 30.3 | 24.0 | |||
Net result | 15.2 | 13.0 | |||
Return on average shareholders' equity (%) | 8.6 | 8.1 | Return on average shareholders' equity | Net result / Average shareholders' equity | |
EBITA margin, recurring (%) | 5.0 | 4.8 | EBITA margin | EBITA recurring / Operating income | |
Earnings per share (€) | 2.97 | 2.59 | Earnings per share | Net result / Number of ordinary shares issued | |
Balance Sheet | |||||
Total assets | 362.5 | 342.0 | |||
Shareholders' equity | 189.6 | 163.1 | |||
Group equity | 189.7 | 162.8 | |||
Group equity as percentage of total assets (%) | 52.3 | 47.6 | |||
Financial Position | |||||
Net working capital | (8.7) | (14.3) | Net working capital | Current assets less current liabilities (excluding cash and cash equivalents less amounts owed to credit institutions) | |
Free cash flow | 9.8 | 38.3 | Free cash flow | Cash flow from operating and investing activities | |
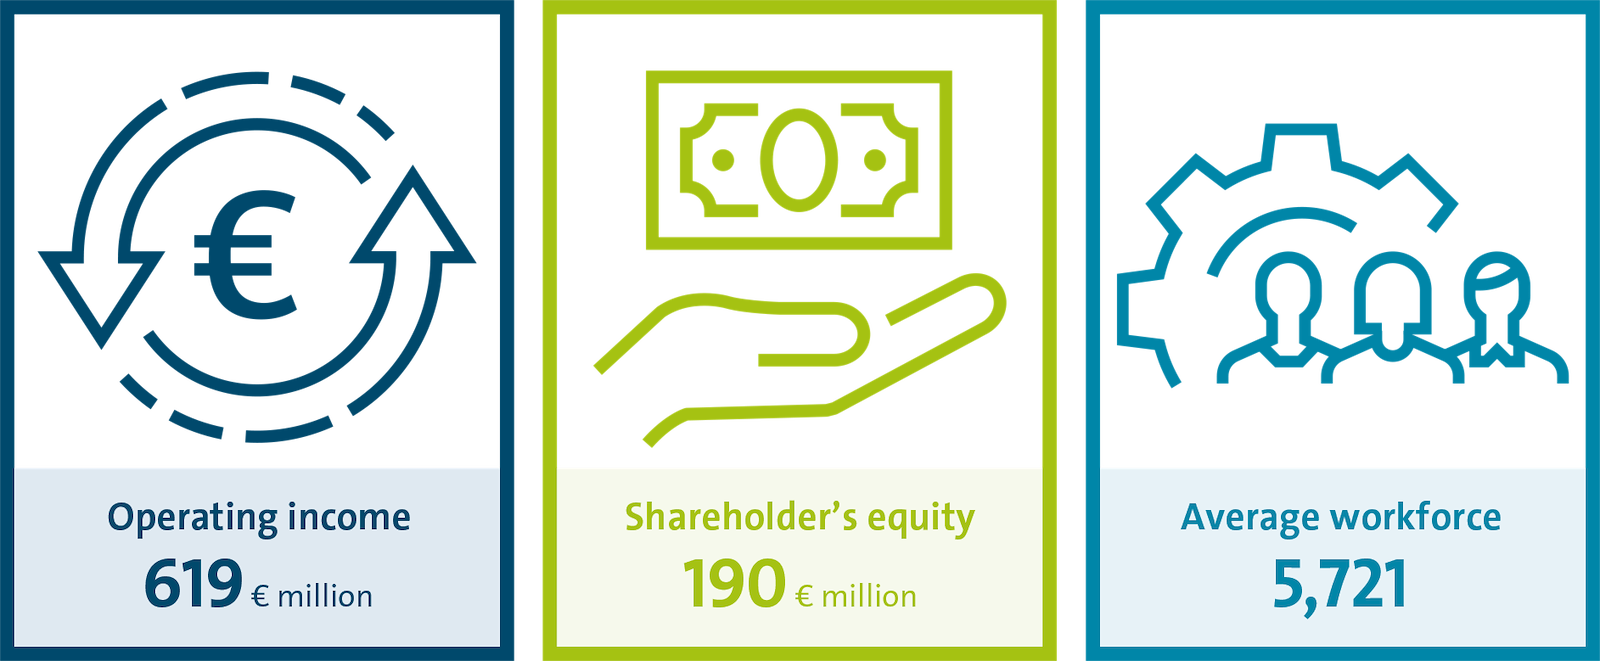
Average workforce includes: employment contracts, contractors, agency workers, freelancers, trainees and sponsorship students.
Accidents & Incidents
Employees
Year-end data excluding non-consolidated minorities.
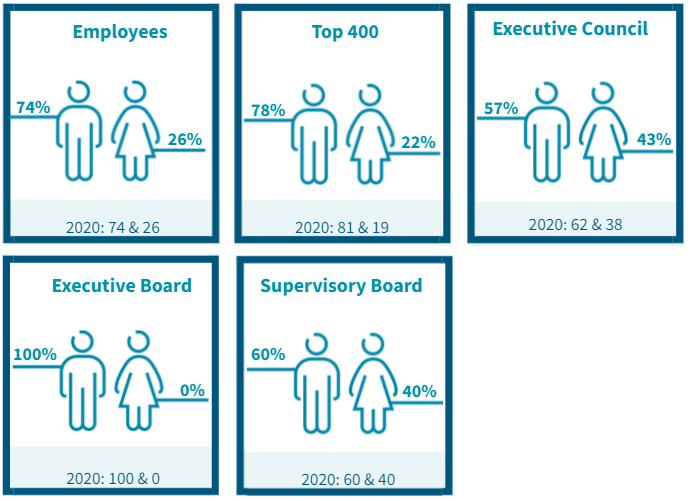
Gender split
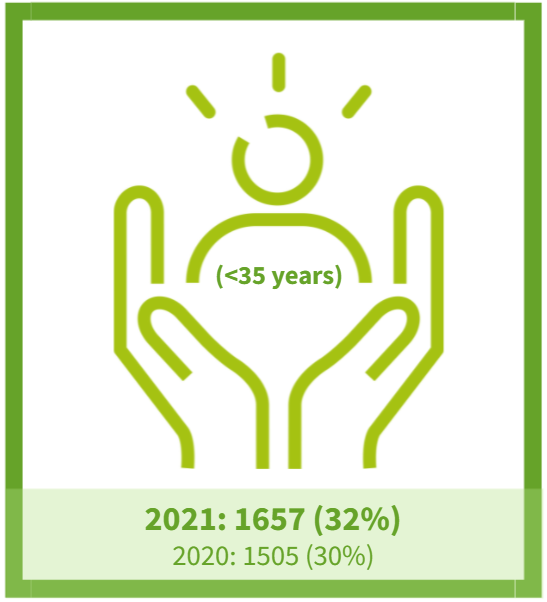
Young Professionals
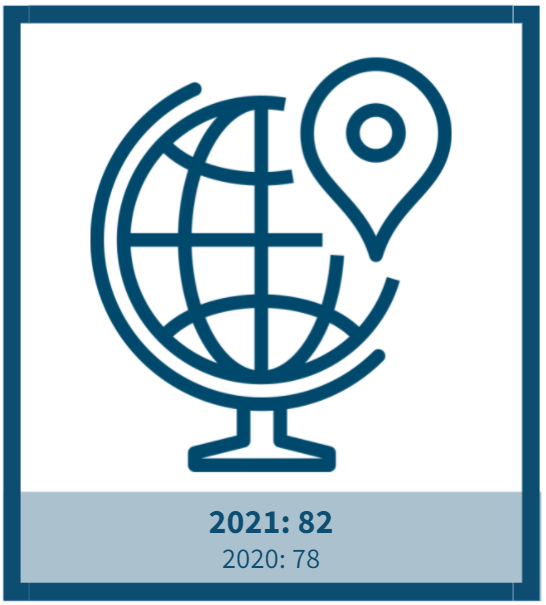
Employee nationalities
Workforce (5,887 year-end)
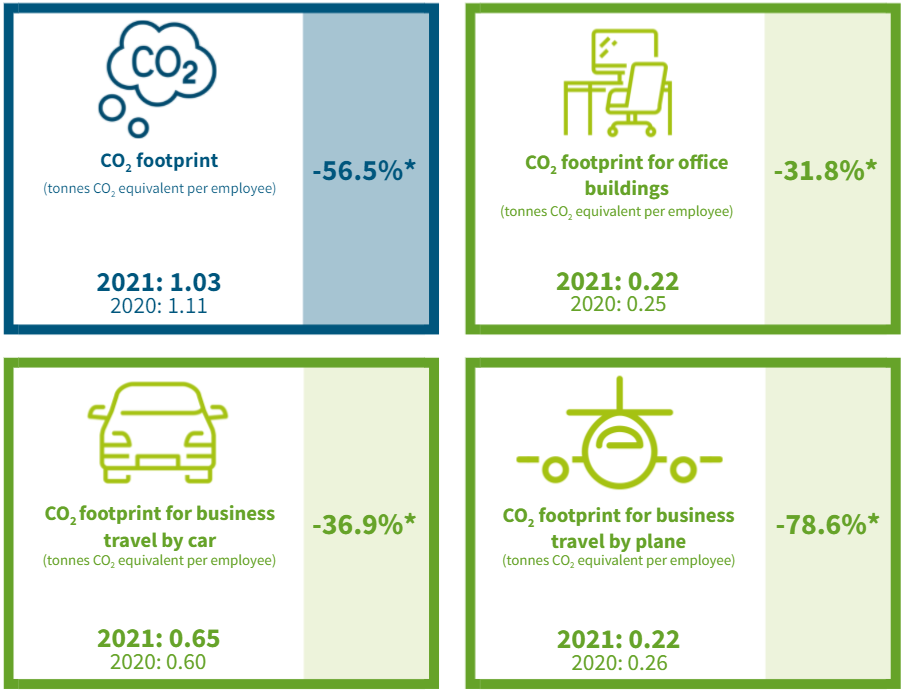
CO2 Footprint per employee
* Trend to 2019.

