Sustainability Key Figures
2024 | 2023 | ||
Employees | |||
Employees (average headcount) | 5,708 | 5,613 | People employed by Royal HaskoningDHV and subsidiaries |
Employees (year-end headcount) | 5,740 | 5,675 | |
Employee engagement (%) | 83 | 80 | The percentage of employees that feel enthusiastic and dedicated towards their job |
Employee turnover (%) | 13.9 | 13.8 | The percentage of employees who left the company |
Employee nationalities | 84 | 89 | The number of countries that employees originate from |
Young professionals (%) | 37 | 32 | The percentage of employees younger than 35 years |
Training and development | |||
Average number of training hours per employee | 52 | 51 | |
Integrity and ethical performance | |||
Registered requests for advice related to project vetting | 92 | 58 | The number of registered requests for advice related to project vetting, like third-party assessments, sanction checks, and controversies related to clients, projects and countries. |
Registered issues and concerns | 79 | 78 | The number of formal and informal non-compliance reports. |
High-risk compliances cases | 3 | 4 | The number of high-risk compliance cases following investigation. |
Gender (% female) | |||
Employees | 29 | 28 | |
Executive Council | 43 | 29 | The Executive Council consists of the Executive Board, the Global Directors and the Director Business Transformation. |
Supervisory Board | 40 | 40 | |
Accidents and incidents | |||
Fatalities | 0 | 0 | Employee deaths caused by accidents |
Submitted accident and incident reports | 202 | 170 | Accidents: events that result in injuries, sickness or damage to property or the environment. Incidents: events which under slightly different circumstances could have been an accident |
LTIF | 0.14 | 0.09 | Lost time injury frequency / 200k workable hours |
TRCF | 3.47 | 2.70 | Total recordable case frequency / 200k workable hours |
Ton CO2-eq | |||
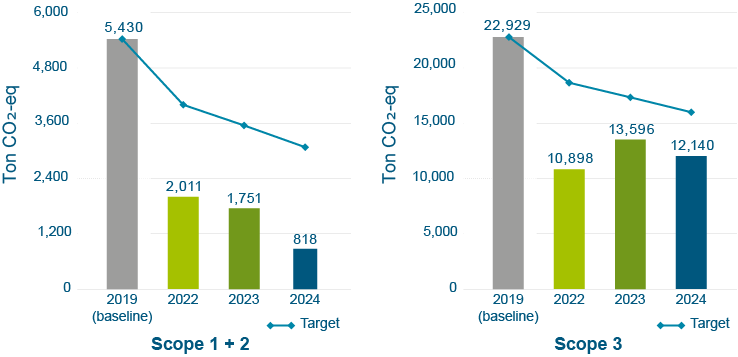
Scope 1 emissions | 697 | 895 | Direct greenhouse gas emissions that occur from sources that are owned or controlled. |
Scope 2 emissions | 121 | 856 | Indirect greenhouse gas emissions that occur from generation of purchased electricity and heat. |
Scope 3 emissions | 12,140 | 13,596 | Indirect greenhouse gas emissions downstream and upstream in the supply chain such as commuting and flying. |
CO2 footprint per employee | 2.26 | 2.70 | Total carbon footprint scope 1-3 / Employee |
Sustainability in our work | |||
Enhancing Society Together client score | 7.7 | 7.5 | Average score (0-10 scale) from the client satisfaction surveys |
Enhancing Society Together project self-assessment (Lite and Full projects) | 3.4 | 3.2 | Self-assessment score of Lite and Full projects' alignment with our purpose. Lite and Full are classifications based on a project's size and risk profile. Projects are assessed against our 5 themes (scores per theme can range from negative (-1) to very positive (+2)). |
Enhancing Society Together project self-assessment (all projects) | 2.7 | N/A | Self-assessment score of all projects' alignment with our purpose (Lite + Full + Basic). |
Projects assessed | 2,403 | 1,117 | Year-end total |
Project revenue assessed (%) | 65 | N/A | The percentage of project revenue that has been assessed for their alignment with our purpose. |
Proposals assessed | 9,179 | 4,335 | Year-end total |
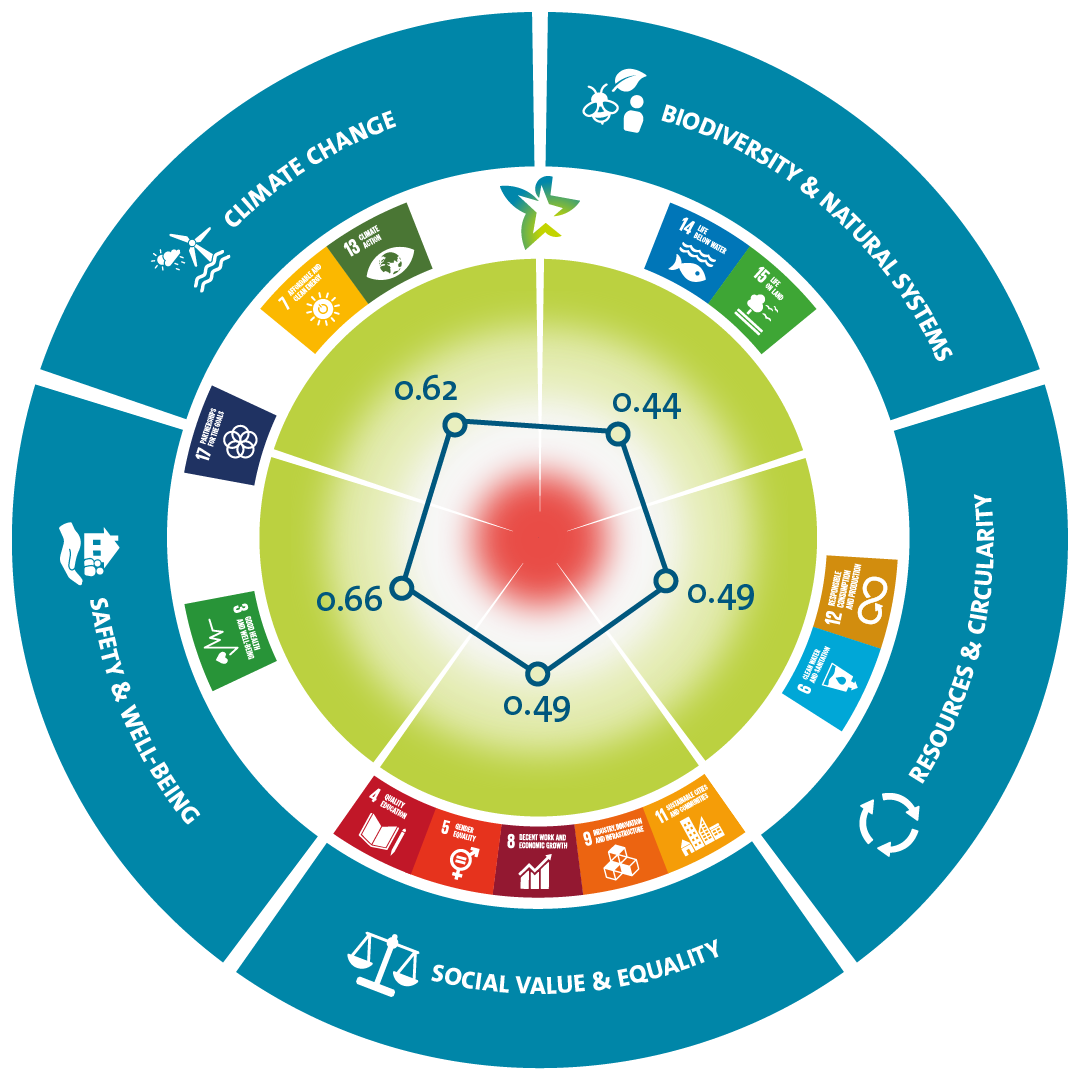
Purpose Chart

This chart shows the areas where we believe we can make the biggest impact in delivering benefits for people and planet, aligned with the UN Sustainable Development Goals. We assess our impact as follows: -1 for negative, 0 for neutral, +1 for positive and +2 for very positive.
In 2024 our ‘score’ across our portfolio increased from 3.22 at the end of January to 3.34 at the end of August. During the last part of the year, we began to include assessments of our smaller projects – still very much Enhancing Society Together (EST) aligned but where on average there is less opportunity to deliver the more significant benefits. This resulted in a steep increase in assessments, from around 800 projects to around 2,400 at the end of the year (2023: 1,117 projects), representing over 65% of our annual revenue, but we saw a dilution of the overall EST score to 2.7 in December.
CO2 emissions

Employees by region (2024 year-end headcount)
