Sustainability Key Figures
2023 | 2022 | ||
Employees | |||
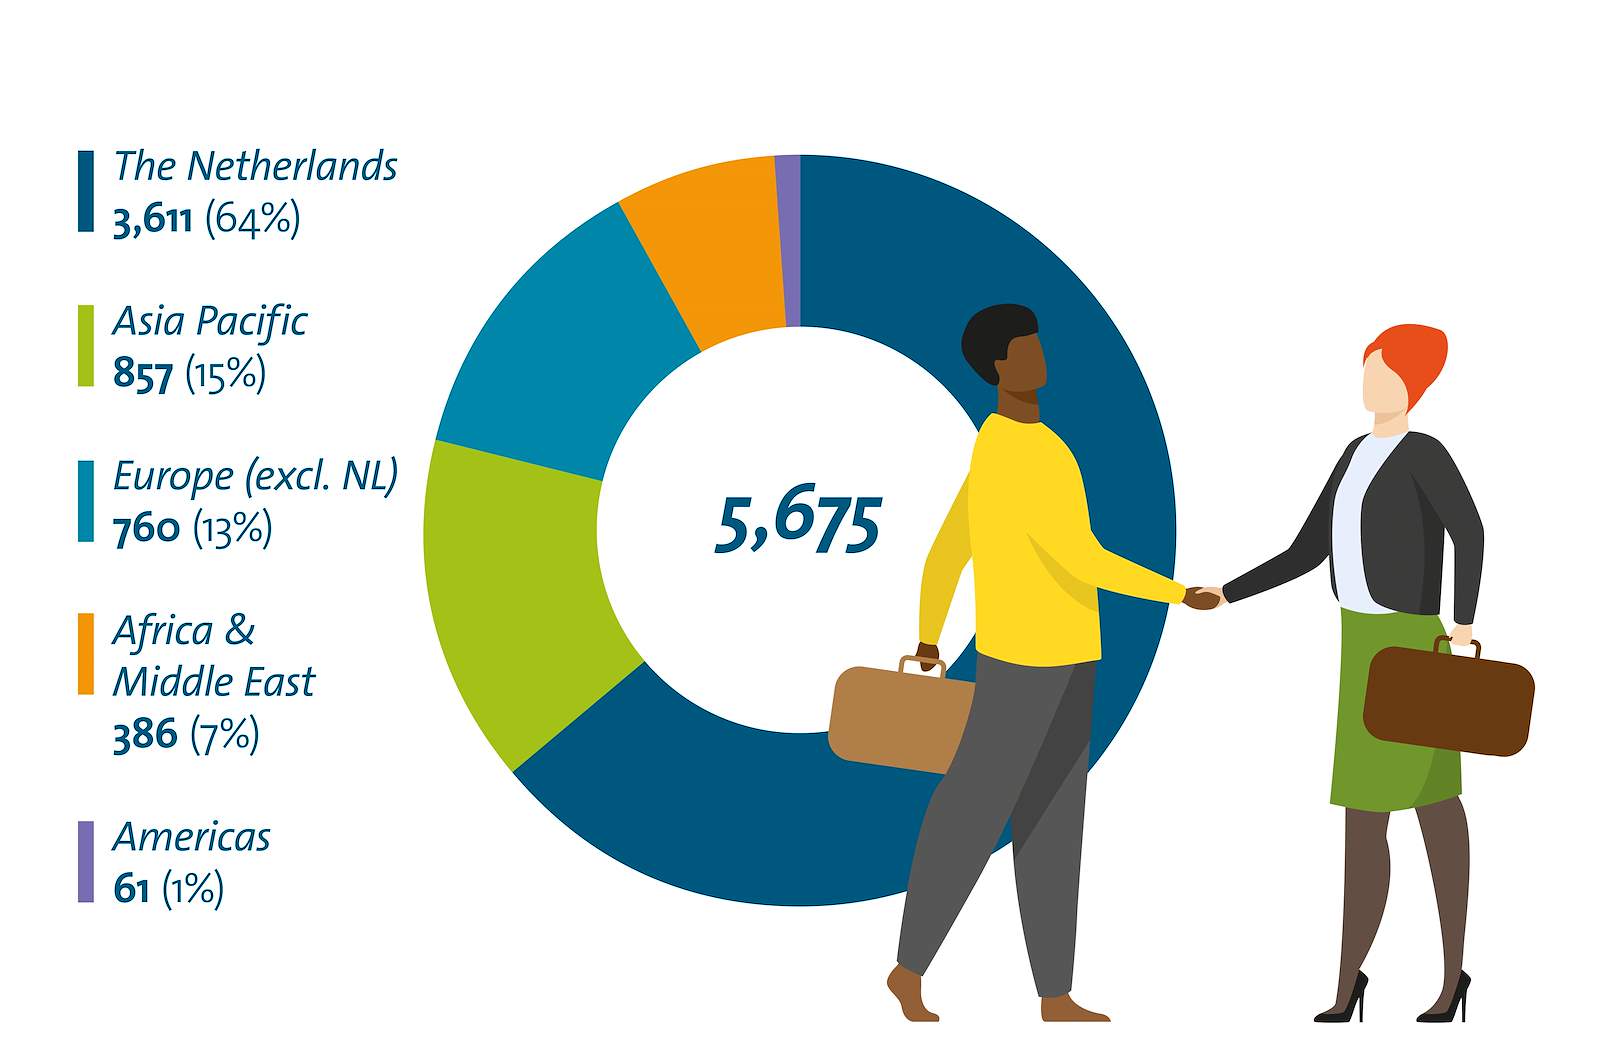
Average employees (headcount) | 5,675 | 5,551 | People employed by Royal HaskoningDHV and subsidiaries |
Employee engagement (%) | 80 | 82 | The percentage of employees that feel enthusiastic and dedicated towards their job |
Employee turnover (%) | 13.8 | 15.8 | The percentage of employees who left the company |
Employee nationalities | 89 | 95 | |
Young professionals (%) | 32 | 33 | The percentage of employees younger than 35 years |
Training and development | |||
Average number of training hours per employee | 45 | 49 | |
Integrity and ethical performance | |||
Registered issues and concerns | 136 | 169 | |
Breaches after investigation | 4 | 5 | |
Gender ratio (% female) | |||
Employees | 28 | 26 | |
Executive Council | 29 | 37 | |
Supervisory Board | 40 | 40 | |
Accidents and incidents | |||
Fatalities | 0 | 0 | |
Submitted accident and incident reports | 170 | 95 | Reports submitted by employees. Accidents: events that result in injuries, sickness or damage to property or the environment. Incidents: events which under slightly different circumstances could have been an accident, a so-called near miss. |
LTIF | 0.09 | 0.02 | Lost time injury frequency per 200,000 workable hours |
TRCF | 2.70 | 1.55 | Total recordable case frequency per 200,000 workable hours |
Ton CO2-eq | |||
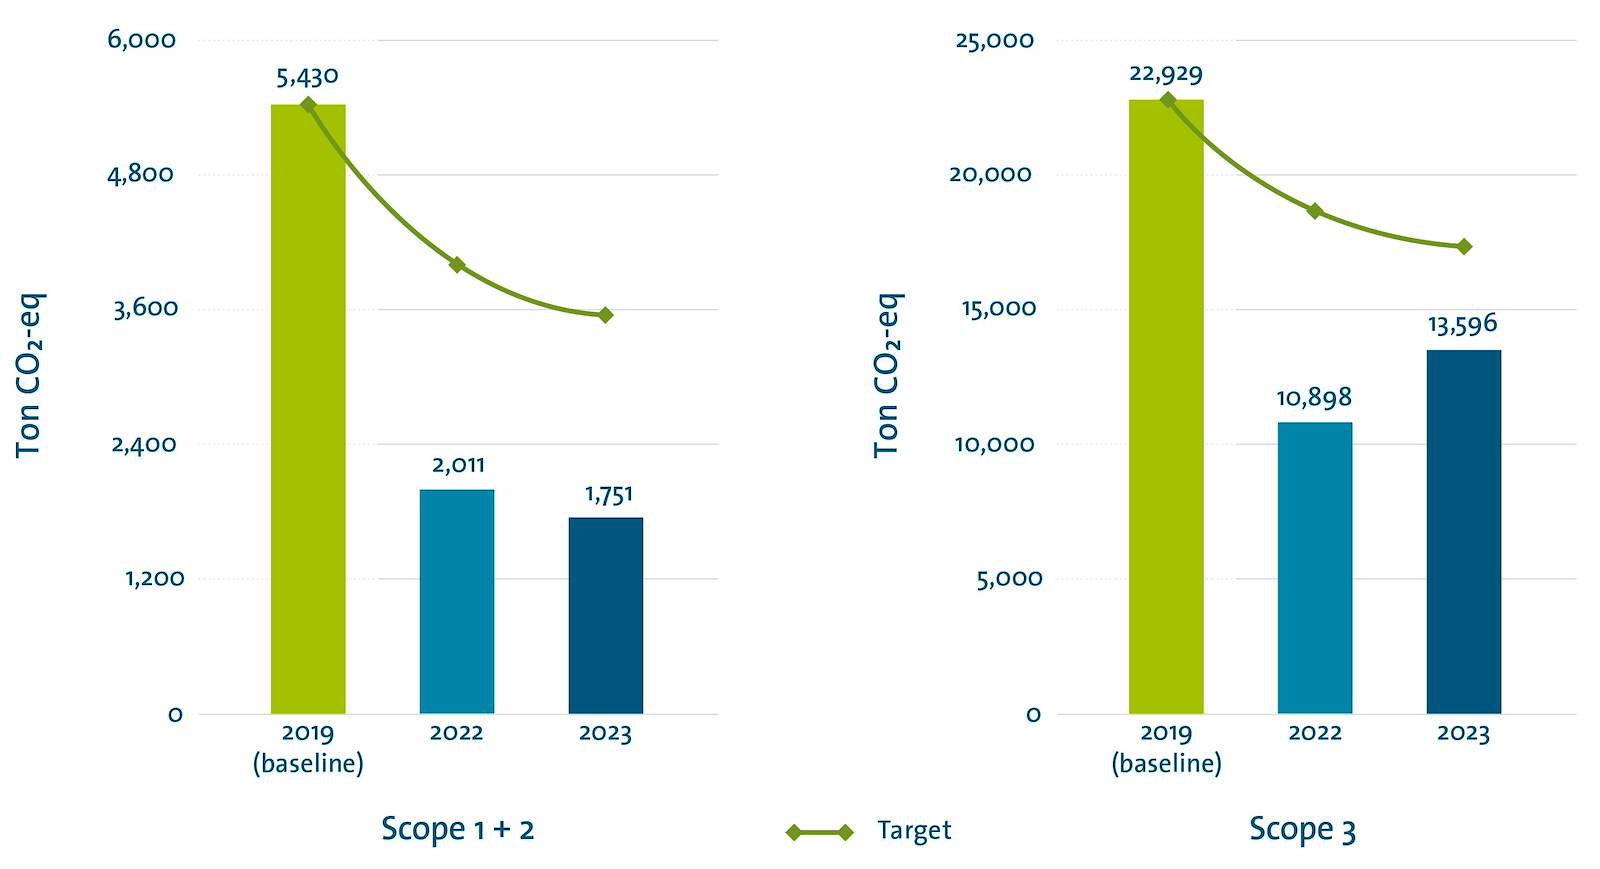
Scope 1 emissions | 895 | 1,244 | Direct greenhouse gas emissions that occur from sources that are owned or controlled |
Scope 2 emissions | 856 | 767 | Indirect greenhouse gas emissions that occur from generation of purchased electricity and heat |
Scope 3 emissions | 13,596 | 10,898 | Indirect greenhouse gas emissions that relate to our activities but which come from sources not owned or directly controlled by us, for example commuting and flying. |
CO2 footprint per employee | 2.29 | 1.98 | CO2 emissions from office buildings, business travel and travel by plan / Average number of employees |
Sustainability in our work | |||
Enhancing Society Together client score (0-10 scale) | 7.5 | 7.5 | |
Enhancing Society Together project self-assessment | 3.2 | n/a | Self-assessment on how well our projects align with our purpose. Over 1,000 projects were assessed against our 5 themes (scores per theme can range from negative (-1) to very positive (+2)) |
Employees by region (headcount)
CO2 emissions
Enhancing Society Together
. Going forward we aim to grow the pentagon further into the green.")
This chart shows the areas where we believe we can make the biggest difference in delivering benefits for people and planet. We assess our impact as follows: -1 for negative, 0 for neutral, +1 for positive and +2 for very positive.
In 2023, we further aligned our projects with our purpose. We measured growth in our performance from 2.97 end-April to 3.19 end-December (2023 target: 3.2). Going forward we aim to grow the pentagon further into the green.